Based on data through April 8, it would appear that we are at a peak (“inflection point” — see original post) of new COVID-19 cases, as reported by the states and compiled by the New York Times. The data are available at github.com.
This is about what I predicted for the nation back on March 30. I had also predicted New York to peak around April 3 or 4, but New York persists on more-or-less a plateau.
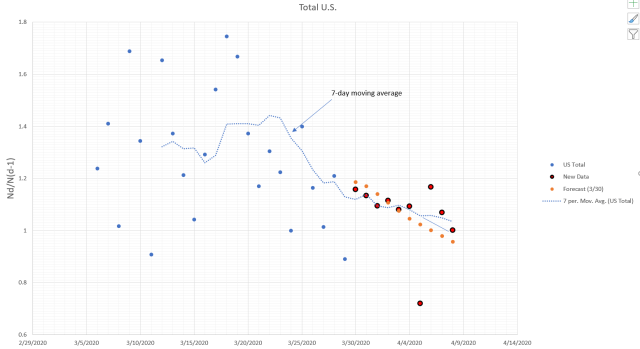
(Actually, the peak number of new cases nationwide, as well as in NY and US ex-NY, all happened on April 4, last Saturday. I’m relying on the 7-day moving average, as opposed to daily data, to call the inflection point as it takes any day-of-the-week influence out of the data.)
The highest day for deaths across the board was April 7, two days ago. That is good news, although the moving average for deaths persists above the inflection point. If this curve trends down, that will be very good news. On the current trend, the inflection point is still a few days away (about April 15 — See below.)

Growth Rate plot of 7-day moving average trends. The projection crosses 1.0 on or about 4/15.
Overall, the number of cases is tracking below my estimates. I’ll stand by my estimate of 800K to 1 million diagnosed infections, although I’ll revise the range of deaths slightly downward to 45- to 55K. If the trends continue improving, those numbers will be revised downward. (The last IHME numbers I saw were updated April 4, and had been revised down to 60,400 deaths, with a range from 32K to 137K. So we’re converging.)