

New Cases continue to track below my estimate. I discount the significance of the recent dip in the curves; I think the 7-day moving average curves applied in the Growth Rate curves are more significant.


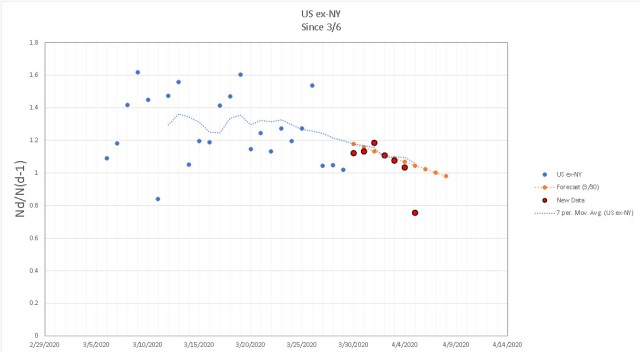
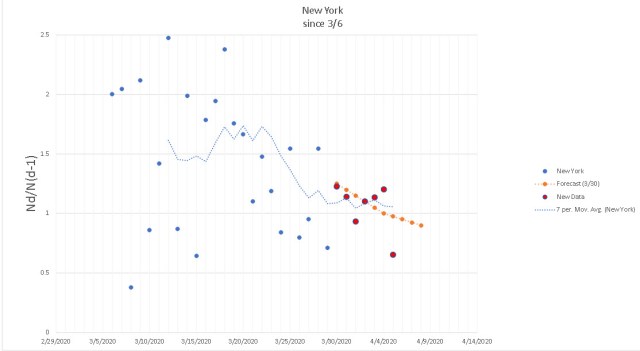 Curves are generally tracking below my original estimates but may peak April 8 or 9. Click to enlarge.
A look at Italy has caused me to adjust my projection of both ultimate cases and deaths. According to Italy curves (worldometer.com – see below), the peak in deaths lagged the peak in “new cases” by about six days. The current ratio of reported deaths to cumulative cases of six days ago is roughly 5.9%.
If the “new cases” curve is symmetrical, half the total cases would occur after the peak. The curve for Italy is skewed to the right, however, suggesting that the majority of cases occur after the peak.
Using the above logic, and my estimate that Total U.S. Cases will peak at 400K cumulative, by estimate of ultimate cases is in the range 800K to 1 million.
Applying the 5.9% to remaining cases suggest ultimate mortality of 48K to 60K.
The IHME estimate of deaths has been updated as of April 4. Estimated deaths 81.8K with a range of confidence from 50K to 137K.
State data courtesy New York Times at github.com.
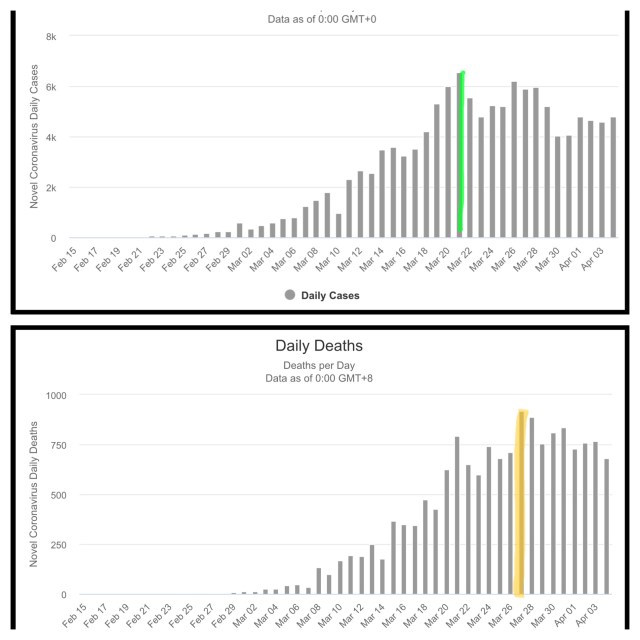
Italy “New Cases” (above) and Italy “Deaths from worldometer.com. It appears that New Cases peaked on March 21, while Deaths peaked March 27. Note that neither curve appears particularly symmetrical about the peak.
