
Benford Analysis is a statistical test commonly used in forensic accounting to identify potential fraud. With partisan suspicions naturally elevated in the wake of the 2020 Presidential Election, a flurry of articles has hit the Internet suggesting use of the technique to spot potentially fraudulent returns, focusing in particular on Philadelphia, Detroit, and Milwaukee. An example is here: https://www.youtube.com/watch?v=GLdPRwvwc2Y
I looked at Milwaukee’s returns by ward in an effort to understand the mechanics of the test and to satisfy myself whether or not it had value in spotting fraudulent election returns. I quickly concluded that the apparent “failure” in Milwaukee is an artifact of precinct size and Biden’s relative dominance in a large number of smaller precincts. Trump got trounced in these smaller wards while he held his own in the bigger ones. A typical Milwaukee ward might total 800 votes breaking 10 to 40% for Trump, so Biden precincts with totals in the 400s to 700s were in relative abundance. The “anomaly” is explainable without fraud (see Occam’s Razor).
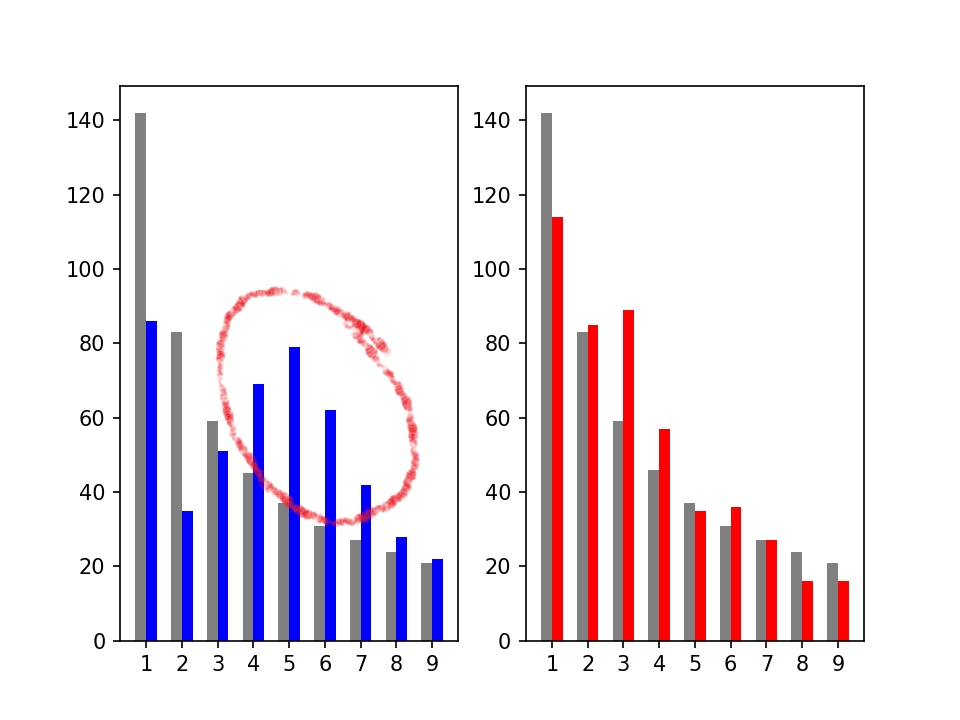
The source of the Milwaukee returns by ward is at the website github.com (access requires free registration). The graphs of the Biden (blue) & Trump (red) curves are shown below. The “first digit” analysis of Trump’s precinct totals conforms reasonably well to the pattern anticipated by Benford’s Law (grey); Biden’s does not. The “hump” in the first digits 4 through 7 is the supposed red flag.
Here is a histogram of the size of the total Biden + Trump vote by ward:
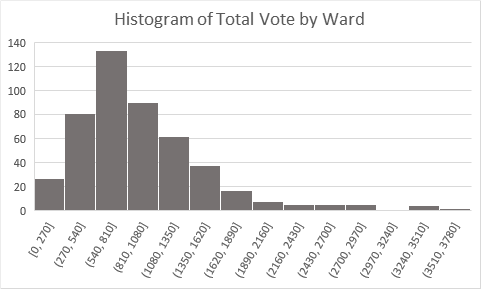
90% of the precincts had vote totals < 1620. The average is about 945 votes per ward and the median is 809. 50% of the precincts had vote totals between 560 and 1,220.
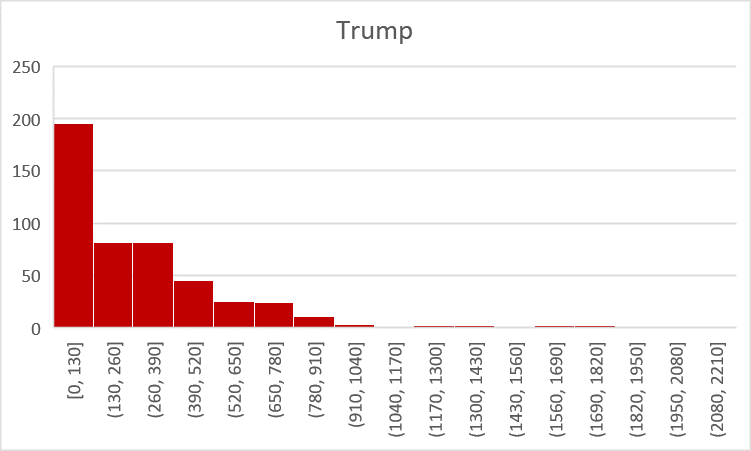
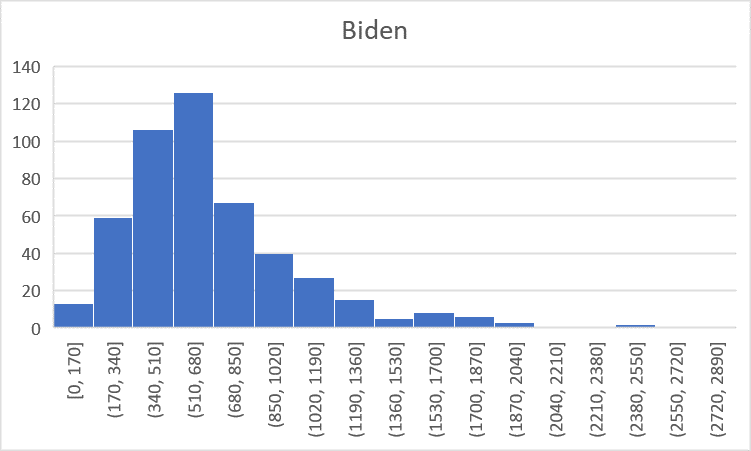
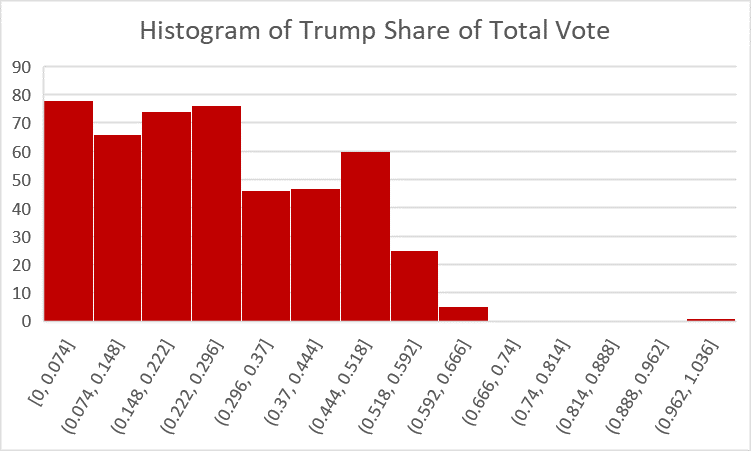
Here are the histograms by candidate. The bin sizes don’t exactly match but they are close enough for illustrative purposes. You can see that the majority of Biden’s votes came in chunks of 200 to 800 votes per ward.
This is a stacked column graph of the Trump vote (red) and the Biden vote (blue).

The lower-numbered precincts on the left side of the chart are presumably older and smaller and they obviously vote more Democratic. This is where the bulge in the snake comes from.
Just on the “1’s”, Trump had 10 precinct totals in the 1000’s (1,000 to 1,999), 85 in the 100’s, 13 in the 10’s, & 1 “1”. Total of 109.
Biden’s corresponding totals were 72 in the 1000’s, 14 in the 100’s. Total of 86.
But on the 5’s, Biden had 72 counts in the 500’s. Trump had 1 “5”, 16 “50’s” and 19 in the 500’s, a total of 36.
A quick desktop drill-down on the Milwaukee numbers explains to my satisfaction how the “anomalous distribution” of first digits came to be, and why it is not an indication of fraud. I’m an engineer by training and profession, not a statistician, but I’d bet my paycheck Benford Analysis is a blind alley for those seeking evidence of ballot shenanigans, at least in Milwaukee.

i just hear about benford and election today. but my understanding is that it works for a sample that would be tied to an exponentially increasing populations and the wards of milwaulkee to not fit that criteria because they are revamped after every census so that each ward has more or less the same number of voters.
Yes, that is my conclusion in a nutshell.